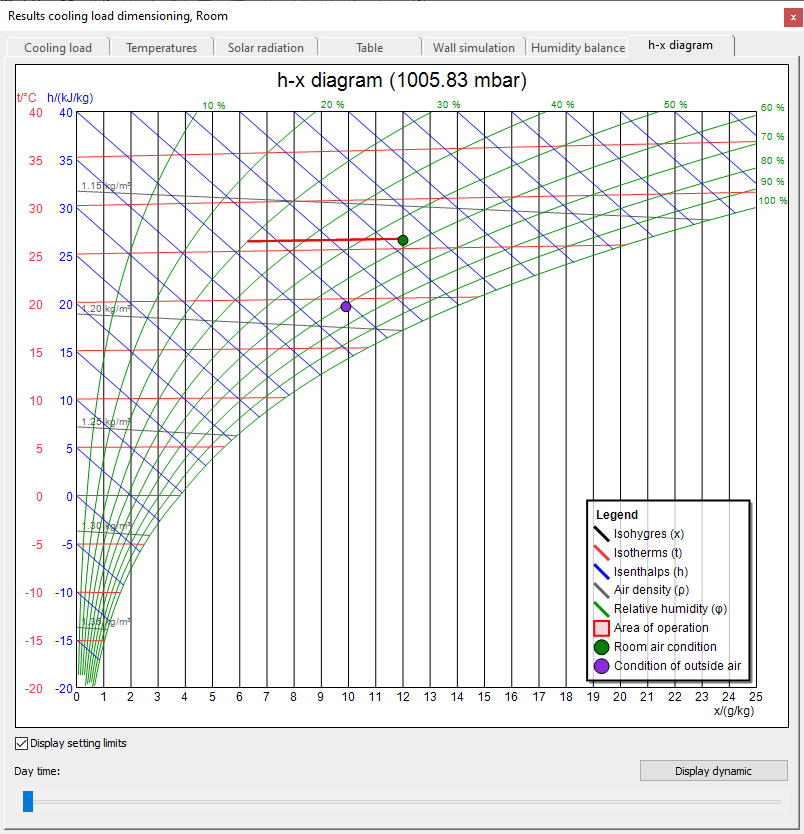
Details on Results, Room – h,x, Diagram
Information on the h-x diagram tab in the dynamic cooling load calculation results at room level.
You are here:

Diagram
Display of a Mollier-h-x diagram with optional dynamic marking of the operating field during the course of the day.
Display setting limits
Activated: Marks the comfort zone that was either specified in the options on project level or by lower and upper limits of absolute and relative humidity for the current room in the diagram.
Day time
Shows the change of the room and outdoor air condition and - if activated - of the comfort zone during the day. You can move the slider manually or click Show dynamics to display a simulation over a course of 24 hours.