Details on Visualization
Information about the Visualization dialog in Pipe and Air Duct Network Calculations.
Have the calculation results and other properties of the pipe and duct network displayed in color in the model.
You are here:
Applies to: Heating, Potable water, Waste water, Ventilation, Cooling.
Or:
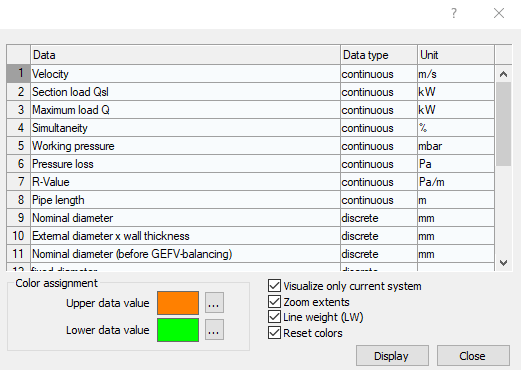
Data
Shows the kind of information which is displayed in color in the model. The kinds of data vary in the different disciplines.
Data type
continuous: The data are displayed by a color transition between the upper (maximum) and lower (minim) value.
discrete: Data in evenly distributed valence intervals are assigned with preset colors in a fix sequence.

Unit
Shows the unit in which the visualization of the information is carried out.
Color assignment
For the continuous data type, you can select the colors for the upper and lower data value using the ... button.
Visualize only current system
Enabled: If there are several systems in the project, only the system selected in the calculation dialog is visualized.
Disabled: If there are several systems in the project, all systems are visualized.
Zoom extents
Enabled: During visualization, the whole model is shown.
Disabled: The visualization takes place in the currently shown model section.
Line weight (LW)
This setting is not relevant in Revit.
Reset colors
Enabled: After finishing the visualization, the pipes or ducts are returned to their original color display.
Disabled: After finishing the visualization, the pipes or ducts keep the colors of the visualization. After closing the dialog, the current view remains in the Properties temporary view mode, which you can exit manually after the analysis is complete.
Display
Starts the visualization of the selected information with the desired settings. A dialog opens where you can customize and filter the visualization in more detail. Pressing Esc brings you back to the Visualization dialog.