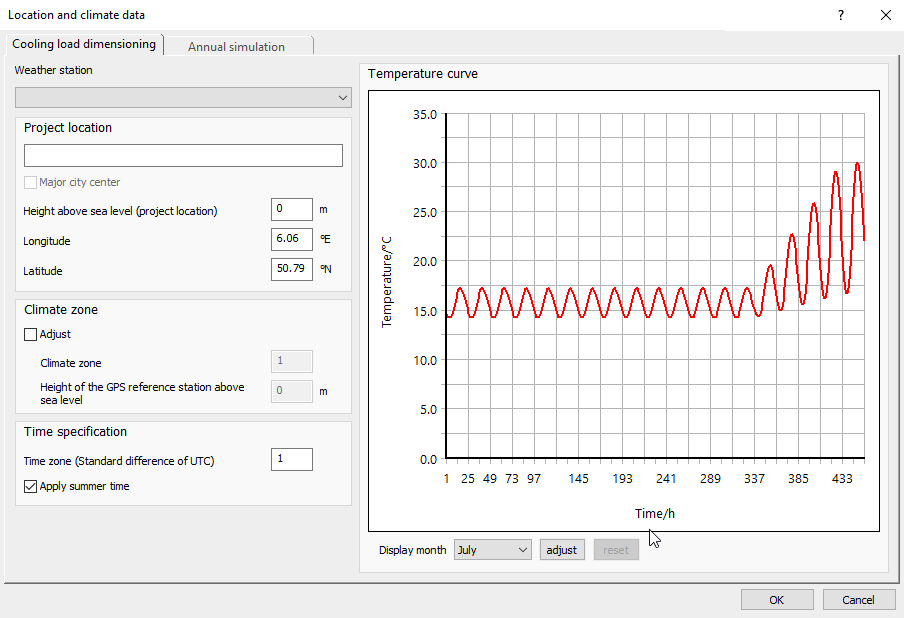
Changing the Temperature Curve
Shows step-by-step how to change the user-defined framework parameters of the temperature curve for the selected display month.
Before you begin
You want a user-defined temperature curve underlying the dynamic load calculation.
Requirements:
You have set Aperiodic setting with CDP as the stabilization method.
Navigate to:

Procedure
- In the Temperature curve section under the diagram, click on Change.
The Generate/change temperature curve dialog opens.
- Change the framework parameters in the Feed or CDD column as desired.
- Click on Generate temperature curve.
The temperatures for the CDP in the table are calculated using the new framework parameters.
- Close the dialog with a click on OK.
Results
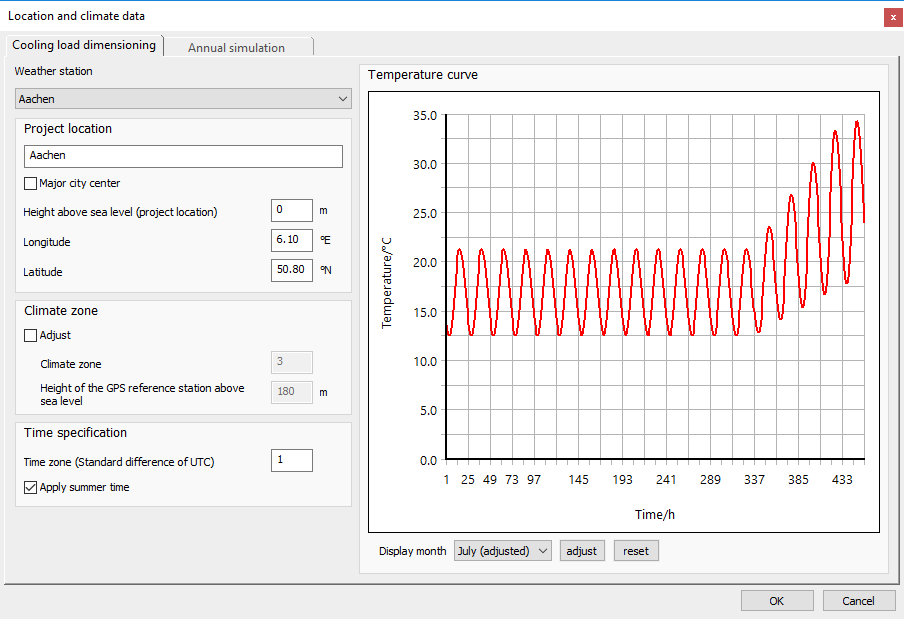
The diagram with the temperature curve for the selected display month is shown with the new temperatures. In the Display month dropdown list, the amendment is after the selected month (adjusted). The cooling load is calculated based on the changed data.
