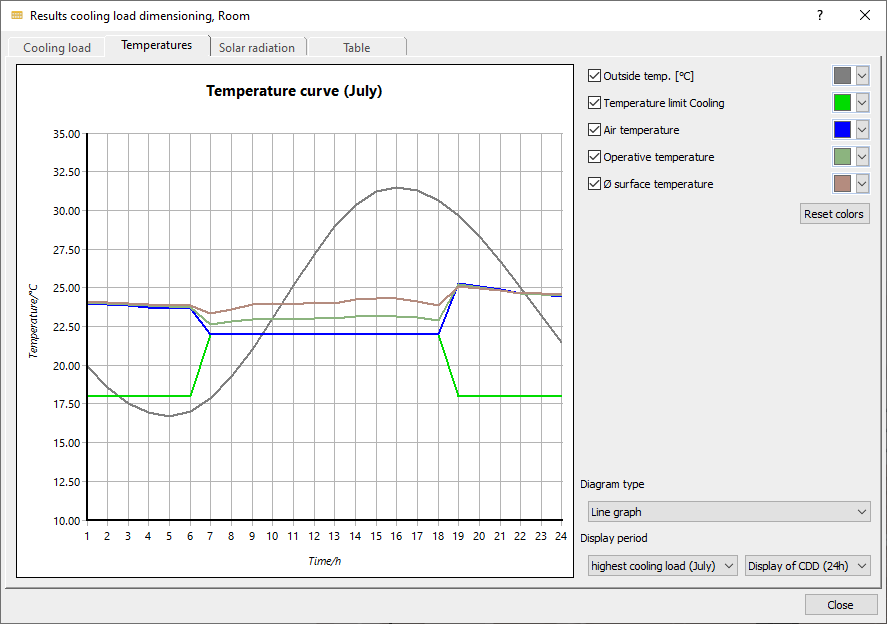
Details on Results, Room - Temperatures
Details on the Temperatures dialog in the room-by-room results of the dynamic cooling load calculation.
You are here:

Diagram
The diagram shows the resulting temperature curve with the activated options over the selected display period, taking into account the set temperatures.
Temperature curves
You can select which temperature curve is to be displayed. The display color of each curve can be adjusted. Click Reset colors to set the default colors.
Further displaying options
Diagram type
You can choose from the following options for displaying the diagram:
-
Bar chart
-
Line diagram
-
Points with lines
Display period
From the drop-down list, you can select which design month to use for displaying the cooling load curve. By default, the month with the highest cooling load is always displayed when the result dialogs are opened. Each month can display either the Cooling Design Day or the entire Cooling Design Period.