Details on Results Annual Simulation, Room - Solar Radiation
Information on the Solar radiation tab in the Year simulation results, room dialog.
You are here:
Diagram
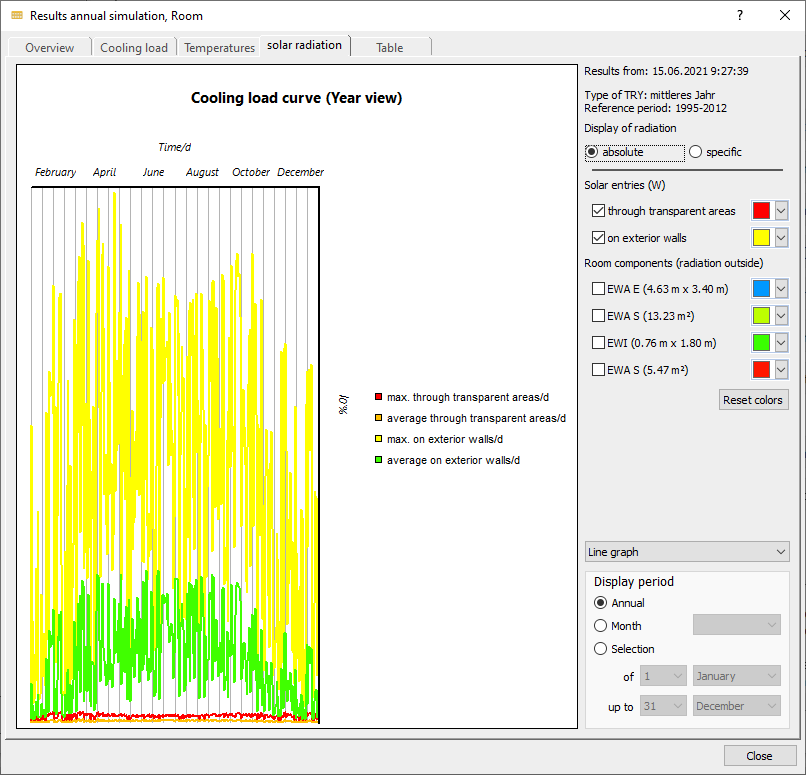
The diagram shows the load curve determined from the year simulation over the selected display period for this room. For each of the options, the maximum and mean load are displayed.
absolute
If this option is activated, the resulting load from the total irradiation for transparent surfaces, exterior walls and sunlit room components can be displayed for the selected display period.
specific
If this option is activated, the resulting load from the solar irradiation can be displayed per square meter of outdoor area for the selected display period for all sunlit room components.
Reset colors: Restores the default colors for all displayable curves.
You can choose from the following options for displaying the diagram:
-
Bar chart
-
Line diagram
-
Points with lines
Display period
The time frame for the display in the diagram. You can choose either the whole year, a specific month or a manually defined time frame for display in the diagram.