Details on year simulation results, building - cooling load
Information on the Cooling load tab in the Year simulation results, building dialog.
You are here:
Diagram
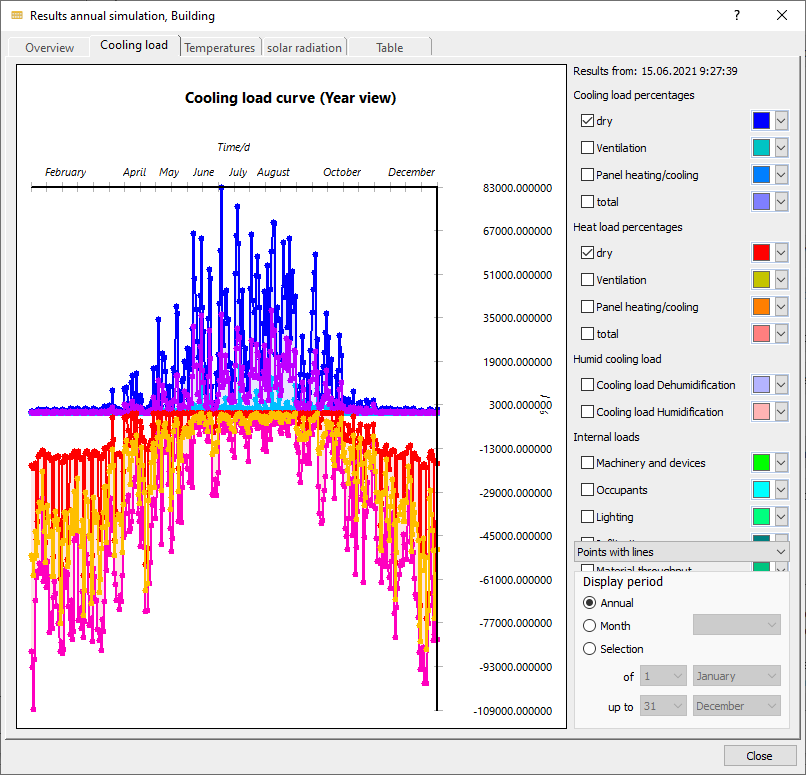
The diagram shows the load curve resulting from the year simulation with the selected options over the selected display period.
Cooling and heating load components
You can choose which parts of the cooling load or heat load you would like to display in the diagram. For each curve the display color can be adjusted.
Reset colors: Restores the default colors for all displayable curves.
You can choose from the following options for displaying the diagram:
-
Bar chart
-
Line diagram
-
Points with lines
Display period
The time frame for the display in the diagram. You can choose either the whole year, a specific month or a manually defined time frame for display in the diagram.