Visualizing Properties in the Pipe Network
Shows step-by-step how to display calculation results and other properties of the pipe and duct network in color in the drawing.
Before you begin
You want calculation results and other properties of the pipe and duct network to be displayed in color.
Requirements:
-
The pipe or duct network is closed an can be calculated.
-
The pipe or duct network is detected.
Navigate to:
Applies to: Heating, Potable water, Waste water, Ventilation, Cooling, Gas.
Procedure
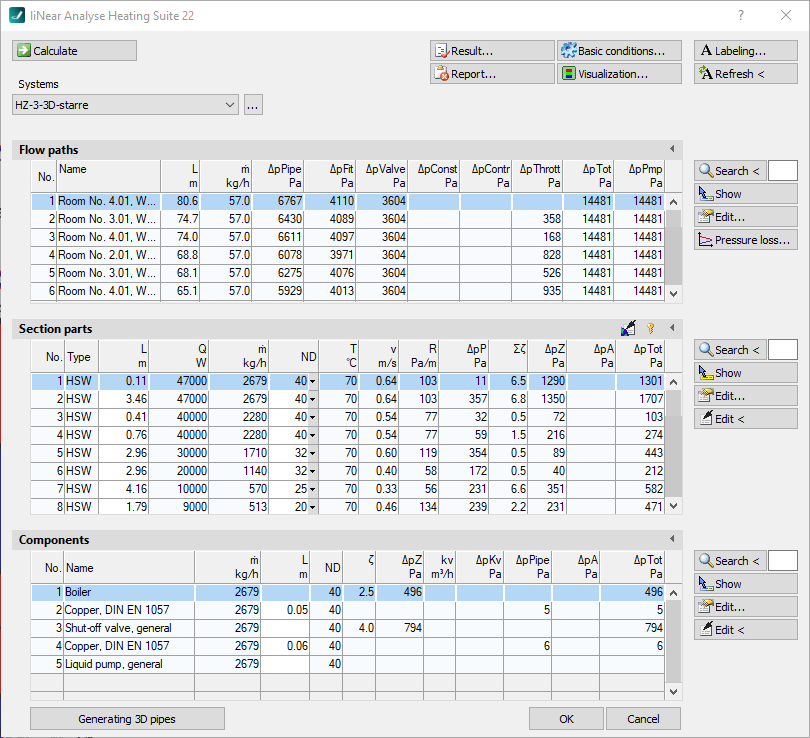
- Click Visualization.
The Visualization dialog opens.
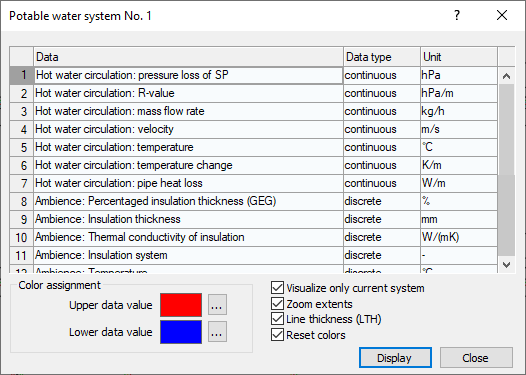
- Under Data select the property to be displayed in color in the drawing.
- If necessary, change the display settings Visualize only current system, Zoom extents, Line thickness (LTH) and Reset colors.
- Click Display.
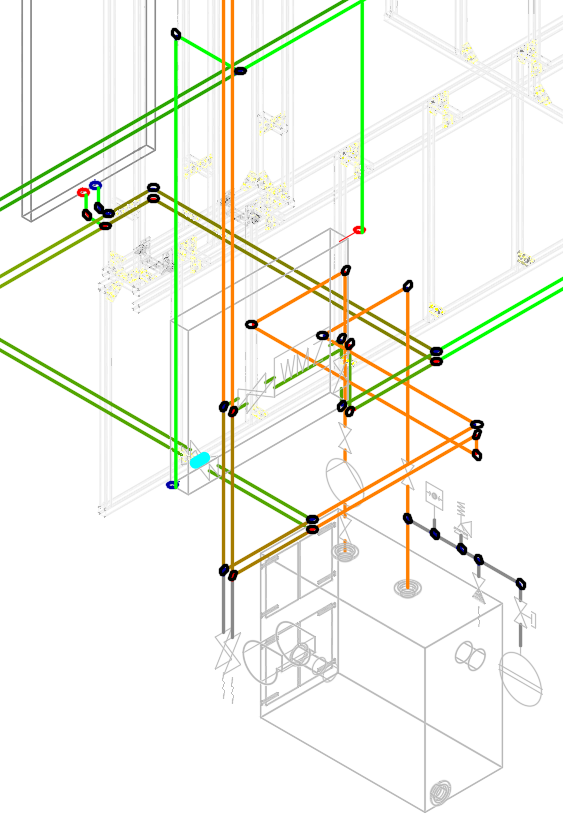
The dialog closes and the selected property is highlighted in the drawing.
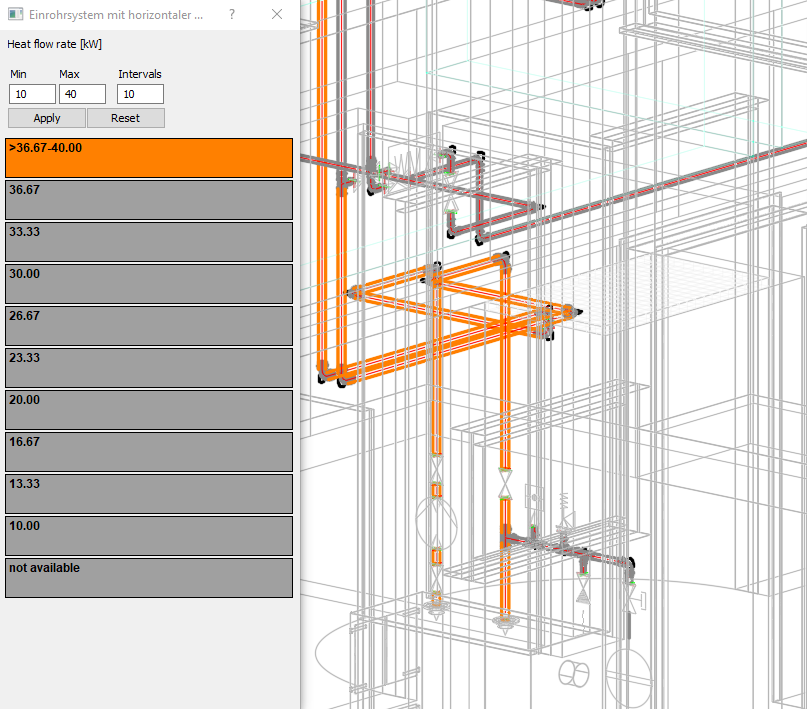
- Using the dialog with further options for the visualization that then appears, you can further filter the view using the Min, Max and Intervals fields and by selecting individual intervals in the color scale.
Results