Details on Visualization Filter
Information about the Visualization filter dialog in the visualization of Pipe and Duct Network Calculation.
You are here:
Applies to: Heating, cooling, Potable water, Waste water, Ventilation, Panel heating/cooling, Gas.
Information type
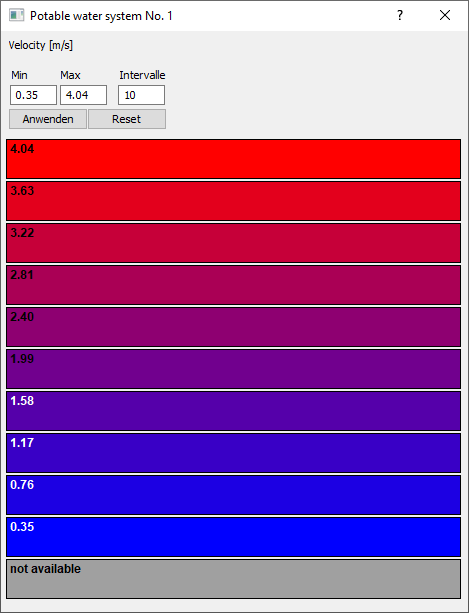
In the upper part of the dialog, the type of information represented by the visualization is indicated with the corresponding unit, e.g. mass flow rate [kg/h].
Min / Max
In these fields you enter the lower and upper limit values for the visualization of the pipe network data. If the predefined value range is changed, pipe network sections with values outside the range are no longer highlighted in color.
Intervals
Specify the number of intervals into which the predefined value range for visualization should be divided. The color scale is automatically adjusted when a new interval value is set.
Apply / Reset
Use the Apply button to apply changed settings to the visualization. Use the Reset button to reset the settings to the original values.
Positioning of the visualization legend in the drawing
You have the possibility to place a legend of the visualization filter in top view of your drawing. Double-click in the dialog to do this. Then, the legend is attached to the cursor and you can place and align the legend in the drawing.
Color scale
The number of color fields corresponds to the number of set intervals. A color field is assigned to each value interval to identify the pipe sections whose values lie within the value interval. By clicking one of the color fields, you can limit the visualization in the drawing to the value interval associated with that color field. Clicking the field again will cancel the filter.